Background
a) NTSB Pipelines Accidents Report
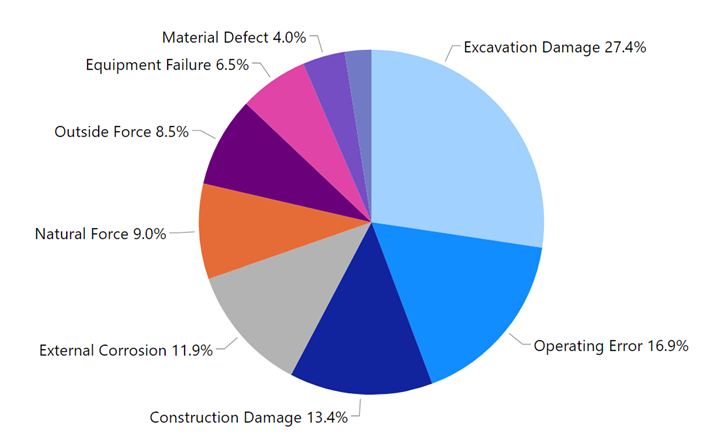
The NTSB incident records are available in ‘pdf’ and HTML formats at the NTSB web site. A total number of 120 incident investigations and 975 associated recommendations were collected from 1969 to 2019. The Figure below shows the distribution of NTSB reported failures resulting from all threats. A significant portion of the incidents (27.2%) was caused by excavation damage.
NTSB Investigated Incidents by Root Cause
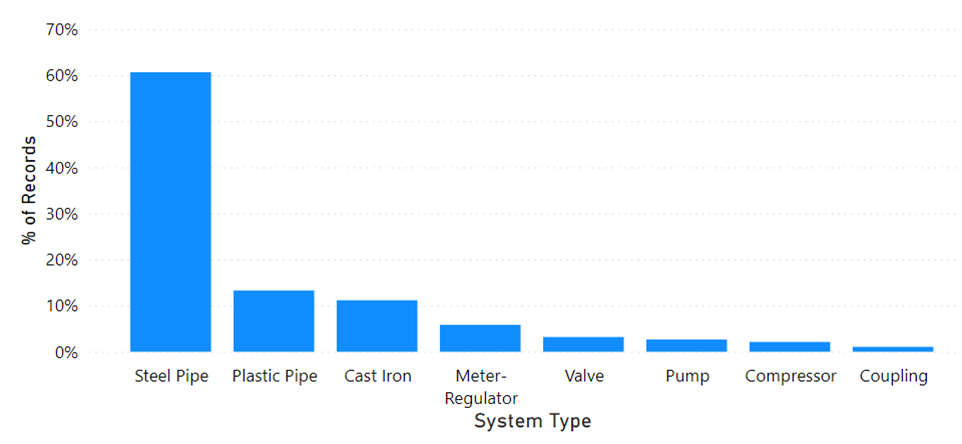
The distribution of the reported incidents by system type is shown in the figure below. About 60% of the investigations were in the steel pipes system.
System Types in NTSB Investigated Reports
b) PHMSA Pipelines Accidents Records
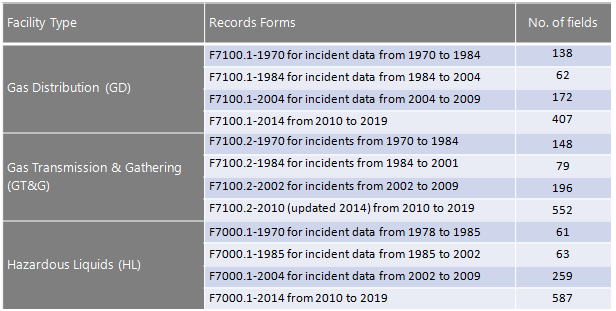
The PHMSA incident records are available in the web site [Link]. The incidents data included different reporting fields from 1968 the 2019 as shown in the following table. these datasets included the following:
- Gas Distribution (GD) from PHMSA incidents records from 1970 to 2019
- Gas Transmission and Gathering (GT&G) from PHMSA records from 1970 to 2019
- Hazardous Liquids (HL) incidents from the PHMSA records from 1968 to 2019